This is a guest technical article from Cadence? Design Systems.
So, you have designed a circuit and are ready to start your simulation. How do you begin?
To start, you need to define a simulation profile. Simulation profiles define the various aspects of a simulation or analysis for various simulators, including PSpice? for TI. Definitions may include the analysis you want to perform and the resources you want to use. Your simulator application will use the circuit you created in the schematic editor of your choice, as well as the profile, to run the simulation and give you tailored results.
This article will specifically explain how to create a simulation profile in the new PSpice for TI design and simulation tool. You can read more about this tool in the technical article, “How to simulate complex analog power and signal-chain circuits with PSpice for TI.”
Step No. 1: Create a simulation profile
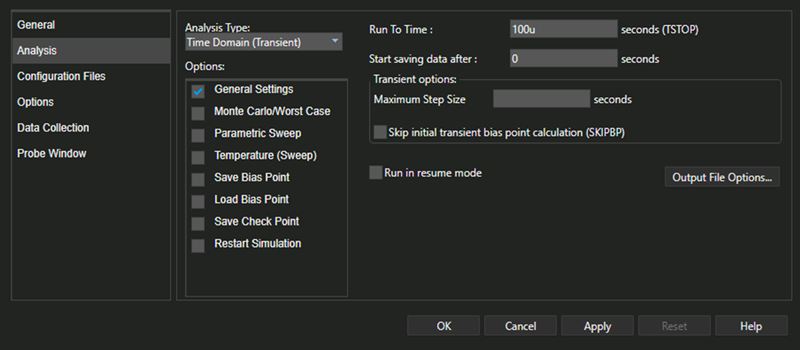
In PSpice for TI, simply choose PSpice – New Simulation Profile from the main menu and give the profile a name. Select a meaningful name, such as “trans,” for a transient analysis profile. This opens the Simulations Settings dialog as shown in Figure 1.

Figure 1: Simulation Settings dialog
PSpice for TI is a mathematical tool that provides a simple mechanism to perform some of the most complex tasks on the planet. However, you can always use netlist and simulation files instead of the easier graphical user interface (GUI) method described here. We will cover text-based simulation in a future installment of this series.
Step No. 2: Choose your analysis type
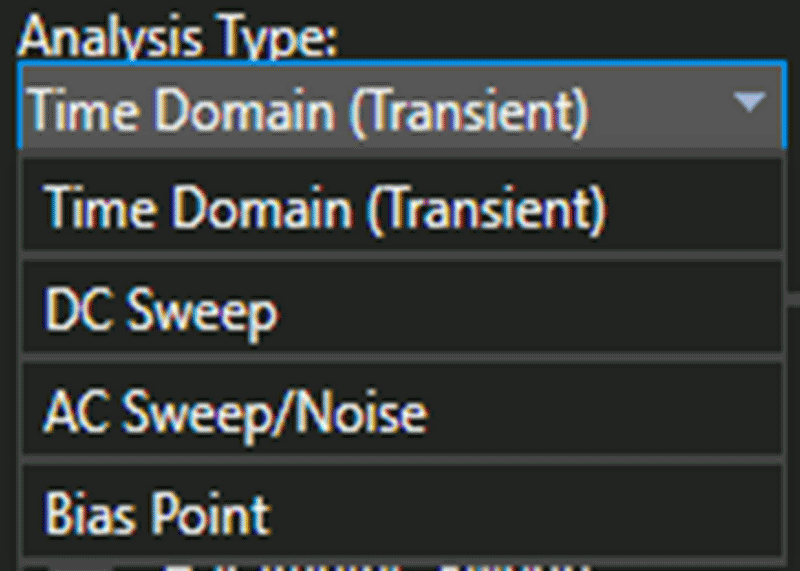
The moment the new profile dialog appears, you will notice that Analysis is selected by default. And, as Figure 2 shows, the default analysis type is Time Domain (Transient).

Figure 2: Analysis Type options
Here’s a guide to the analysis options:
- Time Domain (Transient): Select this option if you want to track voltages, currents and digital states over time.
- DC Sweep: Select this option if you want to calculate the bias point of a circuit or to sweep DC values by simulating the circuit many times.
- AC Sweep/Noise: Select this option if you are interested in small-signal response of the circuit (linearized around the bias point) when sweeping one or more sources over a range of frequencies.
- Bias Point: Select this option if you want node voltages and currents through the devices in the circuit.
Of course, depending on the analysis type, you have several options and parameters at your disposal. The default selection of options is usually good enough, but when necessary, you might benefit from the added power of several other advanced analyses supported by PSpice for TI – such as the Monte Carlo analysis, for example, to determine yield.
Step No. 3: Configure the correct files for simulation
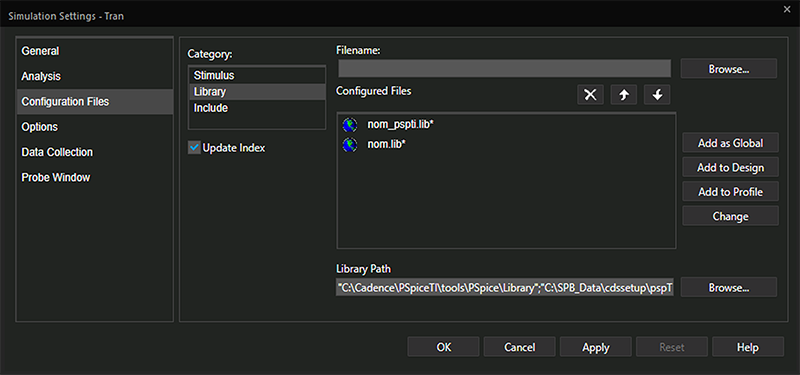
When you select Configuration Files, you are presented with options to set up files in three categories: Stimulus, Library and Include. The Configuration Files tab is shown in Figure 3.
Selecting Stimulus lets you add analog or digital input signals or stimuli for use in simulation. Selecting Library lets you add the libraries containing the PSpice models. Selecting Include lets you add PSpice commands that you want loaded before loading the circuit for analysis. Ensure that all the paths are set correctly here so the simulator can find the necessary files while running simulations.

Figure 3: Configuration Files tab of the Simulation Settings dialog
For now, just ensure that the Library is configured correctly and accept the default for Stimulus and Include.
Step No. 4: Fine-tune options
When you select Options, you see various options in four categories, shown in Figure 4. These options let you fine-tune your simulations. For example, you can specify default values for various parameters, such as speed level (SPEED_LEVEL), relative tolerance (RELTOL), absolute tolerance (ABSTOL) and so on. Again, you will most often use the default values supplied with most of the parameters. But you can always try out different combinations of values to get a better understanding of the performance of your device.

Figure 4: Options tab of the Simulation Settings dialog
Step No. 5: Optimize simulation data
The Data Collection options shown in Figure 5 allow you to restrict the simulation data you capture.

Figure 5: Data Collection tab of the Simulation Settings Dialog
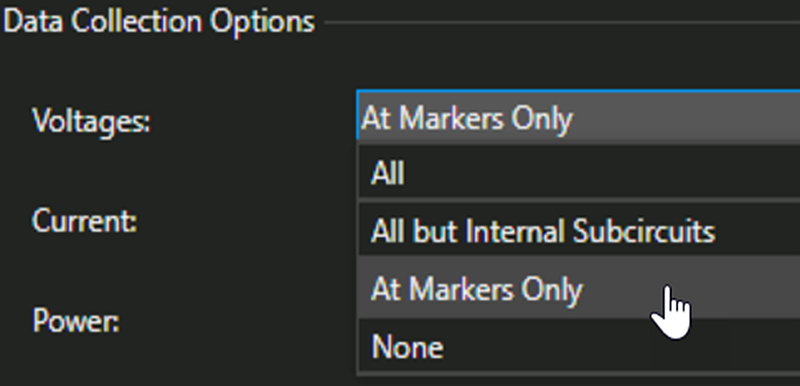
For example, you can collect voltages only where a marker is located by specifying At Markers Only for Voltages, as shown in Figure 6, instead of the default, which is All but Internal Subcircuits.

Figure 6: Options Available for Voltages
Most likely, you will want to use the defaults for this section as well.
Step No. 6: Set up your results display
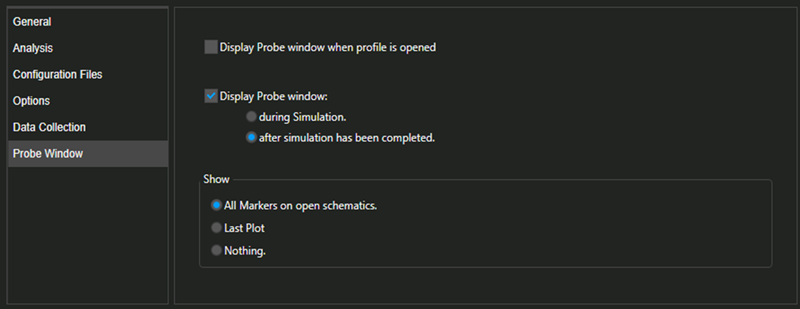
The Probe Window options shown in Figure 7 let you set how to view the results. The options are self-explanatory. For example, although the default is to display the probe window only when the simulation finishes running, there is an option to keep the probe window open during simulation to dynamically update the waveform as the simulation progresses; you then need not wait for the simulation to complete to view the results.

Figure 7: Probe Window tab of the Simulation Settings dialog
Conclusion
Creating a simulation profile is the first and most important thing to do to simulate a circuit. This should help understand the requirements to get started with the PSpice for TI simulation tool. There are many additional features and capabilities that we will cover in future installments of this series.
We encourage you to download PSpice? for TI to start evaluating, verifying and debugging your circuit designs.
Read more in this series


